
This is part two in a series on sharing Juice’s data storytelling method at various workshops around the United States. In part one, we talked about the highlights of teaching business professionals how to build insightful data stories in under an hour. Here we’ll showcase a data story that was built by one of our own Juicers who attended a workshop.
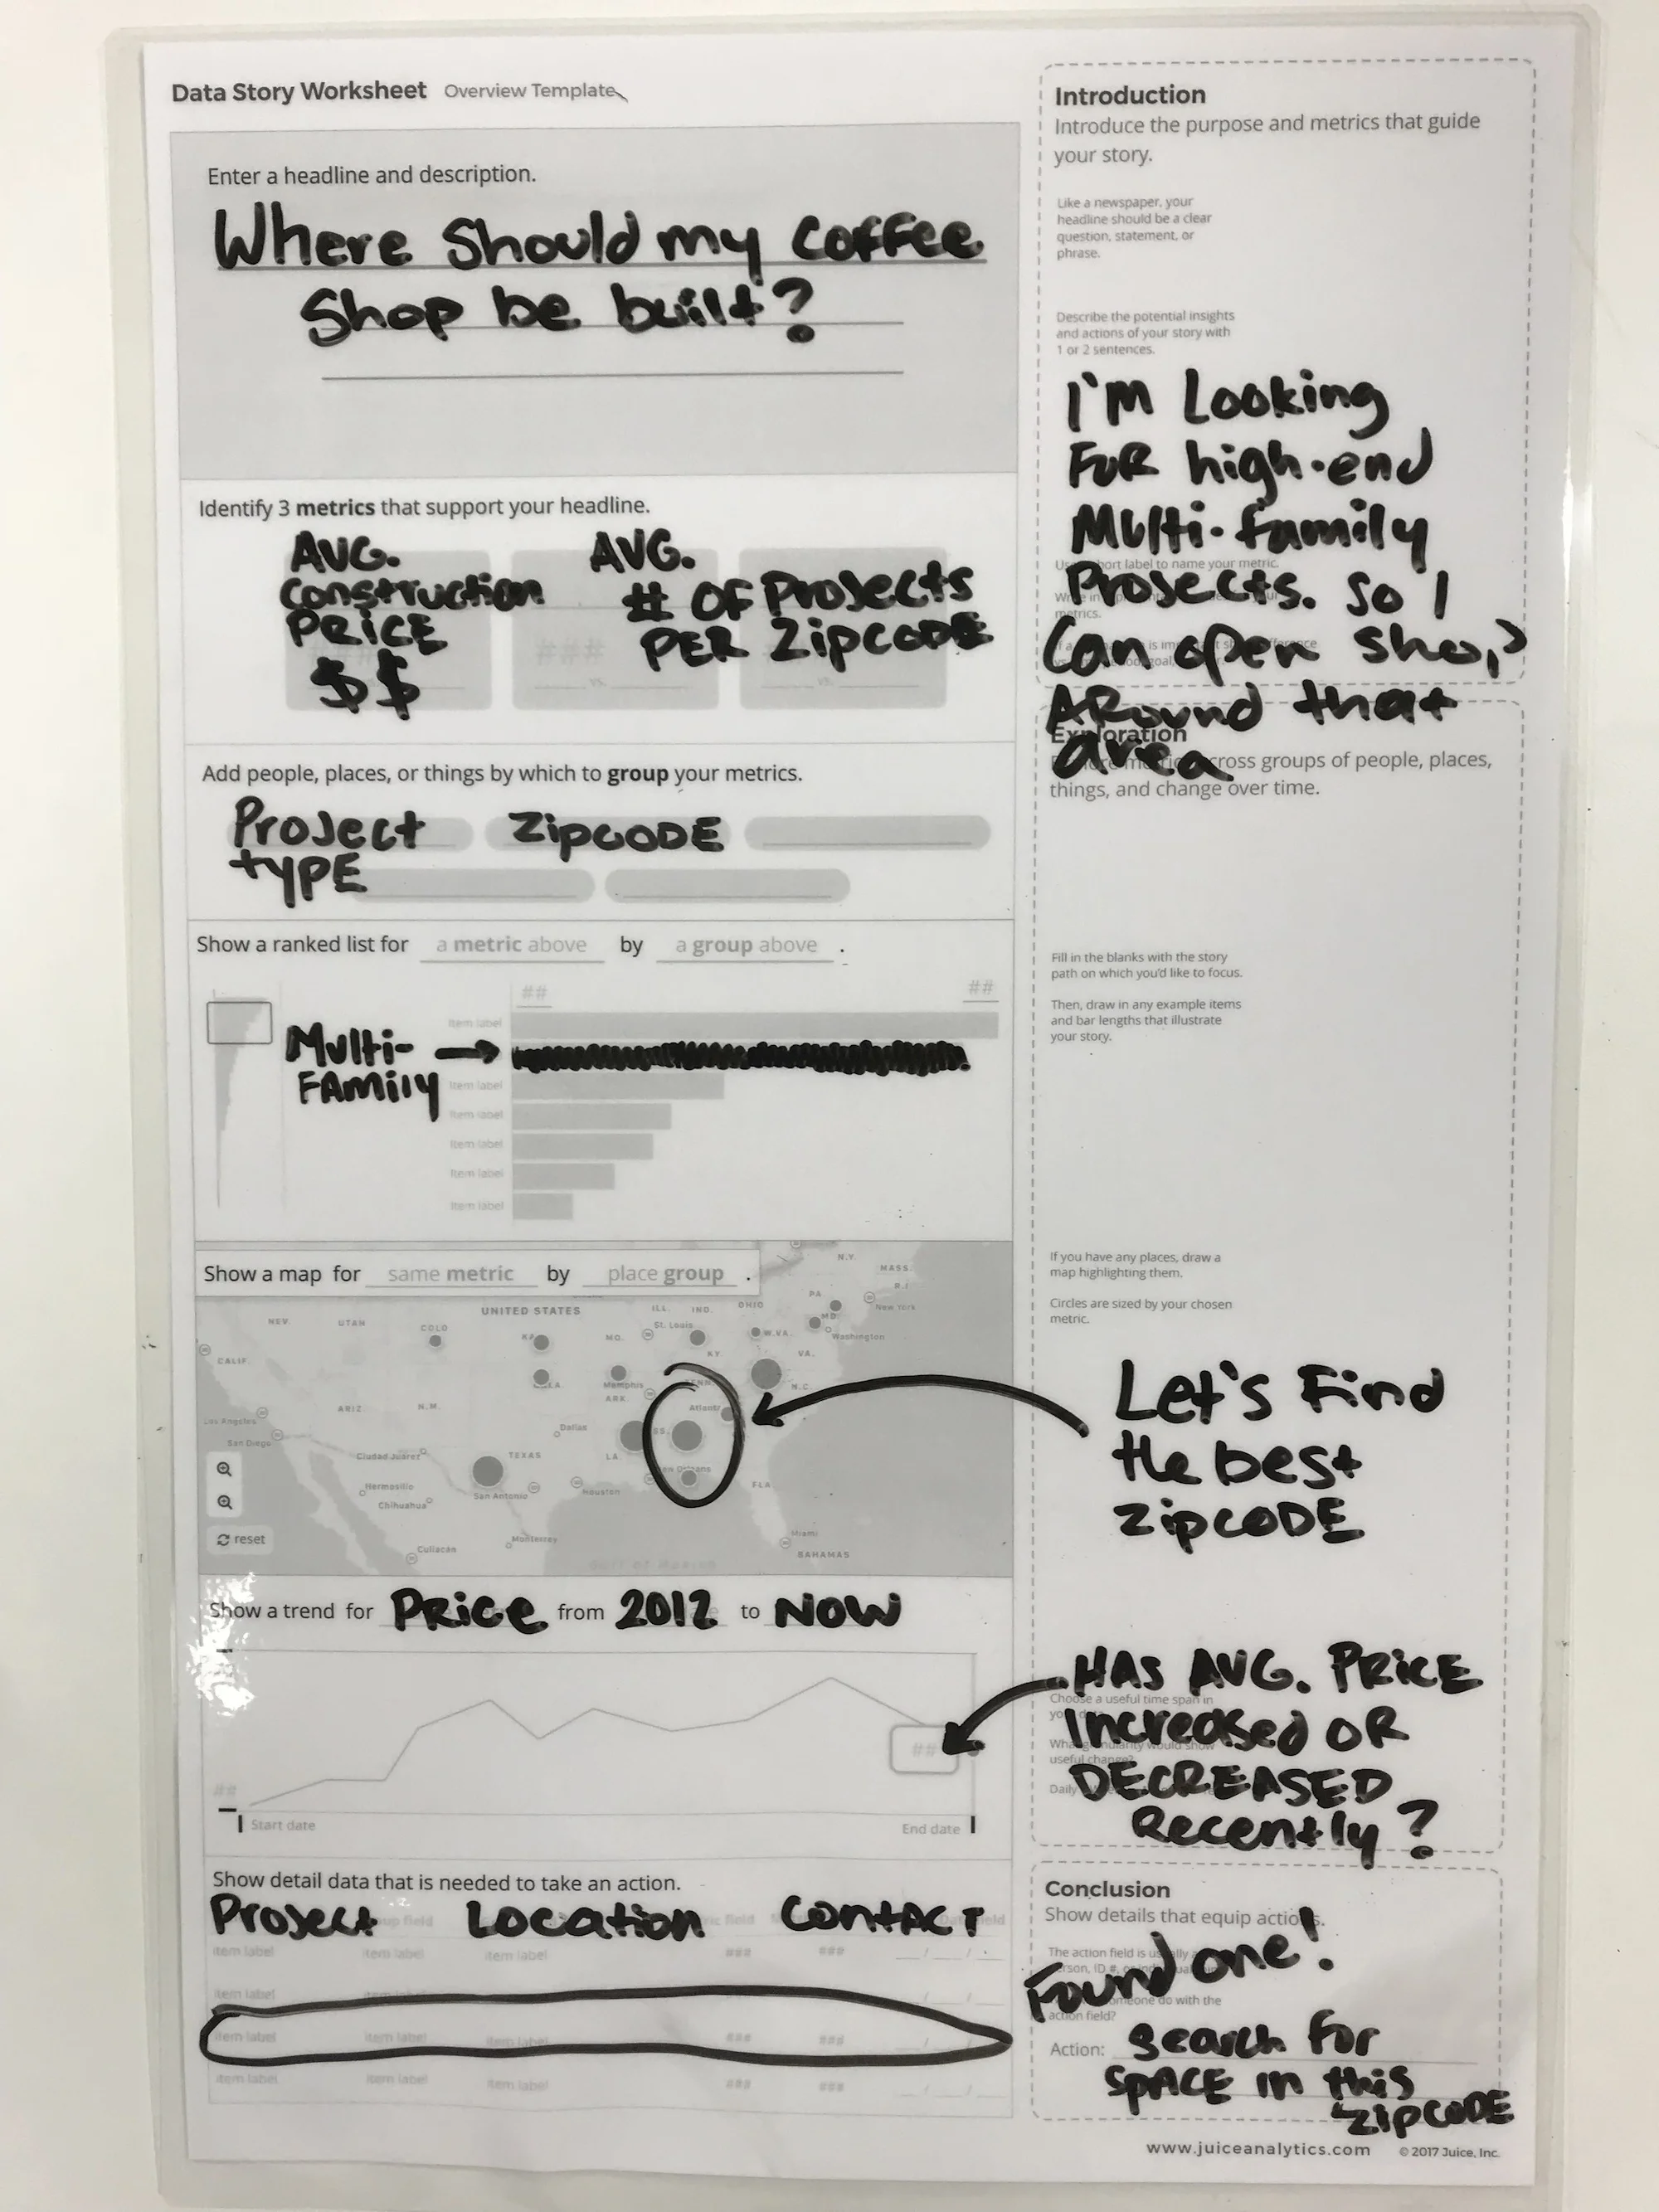
When creating data stories at Juice’s data storytelling workshops, we always start with a set of data from Nashville’s Open Data project. There are an infinite amount of data stories that can be created from a set of data like this that contains information on construction permits, location, cost, and type of building permit. For our data story prototype, we decided we wanted to know where to find construction projects for multi-family housing so that we could determine where to best build a cool new coffee shop.

When creating our data story, it was important to us that we first give it a title. There are many different strategies that you can utilize when coming up with a title, but we decided to start with a simple yet profound question that would ultimately be answered by the end of the data story.
We find that in order to ensure that the data story being created is coherent and focused, it’s crucial to determine how each visualization contributes to the overall goal of the story. In this example, we wanted to have a high volume of people who enjoy a good cup of coffee and would be likely to visit our coffee shop. To display this in our data story, we would zoom into the map to browse areas around Nashville that are sized by the number of multifamily home projects currently underway in a given zip code.
Once we had selected a zip code that had a business-sustainable number of multifamily projects underway, we also wanted to check to see which way the number of projects in that zip code has been trending over the past 5 years. After seeing that the volume of projects in our zip code of interest had been positively trending over the past few years, we would search through the table at the bottom to find the largest one of these projects to build our coffee shop near so that we can maximize our chances for success.
Want to know more about our data storytelling process? Send us a message! We're always happy to share our methodology or to answer any questions.