Data Products

The Best Product Manager: Hustler, Designer, Hacker

Much of what makes a great product manager is empathy and a desire to serve others. Tulsi demonstrates these qualities better than most I’ve come across.  As you will see below, her passion for design as part of product management is only surpassed by that for her customers, products and causes.  Oh, and there is usually much laughter involved. Enjoy and feel free to reach out to her at http://about.me/tulsid.

Even after years of product management experience at several companies, I still get frustrated when folks frequently say “So, you are a Project Manager”. I usually respond with a vehement “No!” and go on to describe what it is I actually do everyday.

With this in mind, let’s begin this discussion by describing what a Product Manager is.  A (good) Product Manager is the champion of the customer and the market: part product visionary and part liaison officer between external and internal needs, pressures, and limitations.

As Catherine Shyu, Product Manager at Send Grid puts so nicely:

“Much of a Product Manager’s responsibility is to juggle multiple streams of conversation and move them towards closure.”

Successful disruptive and innovative brands like Basecamp, Airbnb, Fab, and many others have proven that features alone don’t improve the sales. Instead the infusion of design and love into the products is what creates real customer engagement and advocates. That’s why many of the companies mentioned have consolidated Product Management and Design into single roles or departments. Now the Product Management role is evolving even further.

In the words of Gary Tan

“The ideal startup team consists of: a designer, a hustler, and a hacker.”

The most successful Product Managers I’ve worked with and learned from seem to embody the qualities of all of these three roles. Just consider what these roles bring to the table:

DESIGNER

This role can seem as nebulous as the Product Manager’s, so it’s no wonder they’re coalescing. Whatever the type of designer, success is based on the ability to emphatize,  perceive deep customer needs, and anticipate customer behaviors.

That’s why Product Managers with design and usability skills are able to create experiences rather than the features, simplify the interactions, and sketch and wireframe ideas to tell stories that others can understand.

HUSTLER

Contrary to any negative (and possibly cheeky) connotations, the hustler knows the market, knows how to sell, and knows how to work with what they have to turn a profit. In other words, she knows how to connect products with customer and market needs. The hustler’s skills can help a Product Manager think beyond product design to the critical marketing and sales activities that will make products and companies thrive.

HACKER

Hackers can think creatively, come up with solutions quickly, and iterate through problems they encounter along the way. They are also curious about technology and how things work. Hacker instincts help Product Managers communicate well with engineering teams, and work lean to get the best possible outcomes with the least possible time and resources.

The bottom line: the days of the traditional product manager are gone. Lines are naturally blurring around the Product Management role and discipline, and that’s a good thing! The better you are at blending these three roles, the more equipped you will be at juggling the responsibilities that are on today’s product manager. So, hustle, design, and hack your product into shape. And then tell somebody what you do!

Many thanks to @Imusicmash and @apmcinnes for their comments and feedback.

Explore Sochi Olympic Medal Results

We’re huge sports fans and the Winter Olympics in Sochi is just the beginning of a busy and exciting 2014 sports year. If you’re like us you may not have a few hours a night to hang out with Bob Costas, so we created an interactive summary dashboard of medal results. You can view results by country or event and drill down to the individual athlete if needed. Come back often to see the updated results. Enjoy!

Keep an eye out for visualizations we plan to do for March Madness, MLB Spring Training, NFL Combine, and the FIFA 2014 World Cup.

Extreme Makeover: realtor.com Edition

Have you ever watched one of those miracle-home-improvement shows where they take a house that is a good foundation, but that has been neglected for a bit too long? Nothing’s better than real world practical examples. So, we thought we’d take that approach and apply it to an existing report from the real estate industry and do a little makeover to see if we could make a dramatic improvement. You be the judge.

We found a particular report on realtor.com and we said to ourselves "Self: this data shows a lot of potential!" We really loved it for a few reasons: There is a lot of great information, over 100 different markets, expert commentary and pretty interesting to anyone owning a home or investing in real estate in the U.S. Even still, it feels lacking. What if instead of just making the data available, this report answered some specific questions on the minds of homeowners and investors as well as provided it to them in an easy way to consume this rich information?

Selecting a real estate example wasn’t completely random for us.  With friends and family at Colliers, TelesIntelligence, Berkshire Hathaway Home Services and Keyes, we know there are a lot of opportunities to make real estate data more valuable.

Here is the link to realtor.com’s existing report. Our version of the report can be found here. We downloaded the .csv file that they make available and took it from there. We applied some Juice design principles and help the data answer some specific questions.

Our approach was threefold:

  • Make the report more readable and attractive
  • Offer the reader more guided exploration
  • Offer visualizations that permitted comparisons across markets

Before we did anything we did do a little transformation on the data. We added a dimension for region and broke out city and state into separate columns. This permits another layer of data exploration.

Below are some screenshots of our report makeover.   You can see, and interact, with the makeover version here.

First, we gave the commentary section of the report a little help. Using the Simple Font Framework, we improved the titles, highlighted some of the key trends, downplayed some of the contextual information. Just below that we provided some overall metrics, so that users could compare markets to the U.S. overall averages.

Next, we posed questions that we thought the audience might be most interested in knowing and then applied a visual that would answer that question. In the case of the map the user can toggle the metrics between the month to month and the year over year change in median price. As you notice Maryland stands out on the map, while finding this on the original report takes a little effort.

As with most decisions, homeowners and investors can’t rely on just a single measure to inform their opinion. The leaderboard visualization below allows the reader to view rankings across multiple metrics. In the highlighted example below we compared Denver, Colorado to Seattle, Washington.

The finished version (found here) also provides some additional visualizations and a global filter at the top, but you get the idea. Not brain surgery or something we would use to make actual real estate investments; however a quick 60 minute makeover to call out some of the beauty trapped in this data.

So, what do ya think? Worthy of the Extreme Makeover moniker?

A Checklist for Creating Data Products

“Data is the new oil.” -- everyone (first by Clive Humby)

"Treat data like money." -- Jim Davis (SAS CMO) in The Economist

Are you are sitting on a gold mine -- if only you could transform your unique data into a valuable, monetizable data product?

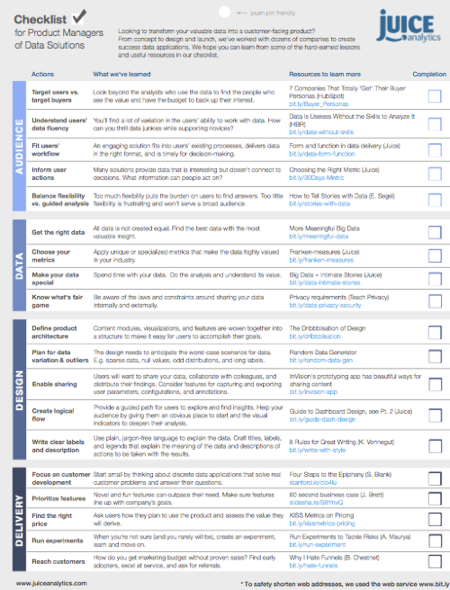
Over the years, we’ve worked with dozens of clients to create applications that refine data and package the results in a form users will love. We often talk with product managers early in the conception phase to help define the target market and end-user needs, even before designing interfaces for presenting and visualizing the data.

In the process, we've learned a few lessons and gather a bunch of useful resources. Download our Checklist for Product Managers of Data Solutions. It is divided into four sections:

1. Audience: Understand the people who need your data

2. Data: Define and enhance the data for your solution

3. Design: Craft an application that solves problems

4. Delivery: Transition from application to profitable product

Happy drilling.

JuiceChecklist-ProductManager

JuiceChecklist-ProductManager

Are you ready for some... data?

If you haven't noticed via various posts and examples, like our Fantasy Football Leaderboard, we are big sports fans.  Over the past year we've gotten to know Ryan McNeil (a former NFL defensive back) pretty well. Learning about the subtleties of college and professional football, as well as sports media, has been fascinating.  As you will see below he is very excited about the new season and the opportunities for better use of data in the profession. Or it could be just that his Hurricanes are currently 3-0. Enjoy!

Football stuff
Football stuff

I love this time of year.  The anticipation of the first week of NFL football always gets my “juices” (pun intended) flowing.  I’ve been astonished by how much data has changed the game since my playing days.

While Sabermetrics, APBRmetricsMoneyball and sports analytics conferences are now well known, the use of data in sports is still in its infancy. The use of information is still exclusive to team leadership (owners, GMs and coaches) and their analytics team. The next wave of data in football and all sports is just starting and ironically I have the same feelings of anticipation as if a new season is just starting.

The next wave is the use of data across many new audiences including agents, players (professional, college and high school) and fans.   This doesn’t mean that we’re going to turn them all into data scientists or that soccer moms will be sharing their R analyses with coaches, but it does mean that data becomes a much bigger part of the sports conversation.

The greatness of football (and sports in general) goes beyond the game experience itself; we also love the conversations, bonds, and memories that are created at every game. What I’ve learned over the past couple of years, particularly being so involved in the media business, is that enhancing these conversations among players, between players and coaches, between agents and teams, and between teams and their fans enhances the sports experience.

So, what has to happen for this next wave and these conversations to take place?  First its not about just giving everyone a new playbook or raw data, but delivering data applications.

A data application is a focused solution that attempts to answer one question or explain a single idea.  Questions like:

Data applications often benefit from being available on mobile devices and should be visually engaging, leveraging the latest data visualization techniques.

Visualization is the WOW factor.  It can engage players to better understand coaches and agents.  It can improve younger players learning curve. Have you ever seen the three ring binders we got to learn plays? For the fans, it can further draw them into the details of the game.

Another kind of visualizaiton

The season of data is only beginning and it’s very exciting. I’d love to hear what you think some of the data applications should be as well as what questions need to be answered to get players, agents and fans more engaged with data.  Email me at rdmcneil@ot-network.com.   I’m anxious to hear what you think. Now, are you ready for some football?

March Madness, Leaderboard-style

The Tournament is upon us. And if you know about picking a brackets, you know it comes down to match-ups, strong guard play, and choosing at least one 12-seed to beat a 5-seed. You also know the winner of your office pool will inevitably be that one non-basketball fan who picks teams based on mascots. Since we're bound for disappointment, why not have some fun with data. Our resident Iona grad, Michel, put together this slick Sliceboard that ranks the tournament teams by offensive and defensive stats. Notice how his school pours in 81 points a game as the 2nd most prolific offense in the tournament. They also manage to have the 2nd worst defense. Sorry Michel, defense wins Championships.

Offensive Leaders
Offensive Leaders

6 Innovative Dashboards Worth Learning From

Dashboards can be dull. Four or six charts laid out in a grid. All data, no explanation or logical flow. In our white paper on dashboard design (PDF), I got a little perturbed at this model because it offers so little guidance to the reader. In hopes of sparking some new thinking, here are a half-dozen dashboards that demonstrate innovative designs and features.

1. ThinkUp: Dashboard as News Feed

ThinkUp
ThinkUp

This clever social media dashboard focuses on the changes and news-worth data updates. Each timeline element that flows down the page can be expanded to show details that supports the headlines.

2. SumAll: Trends, annotations, and goals

SumAllDash
SumAllDash

SumAll's recently released tool for trended business data is beautiful in its execution. The interface puts multiple metrics on the same chart to make it easy to see how trends correlate to each other (even though they are on different scale). SumAll does a nice job with allowing user-created comments, setting goals, and anticipating how users will want to read the data. If you design dashboards, it is worth signing up to absorb some of the nice design touches.

3. AppFirst DevOps Dashboard: Key metric trends and thresholds

AppFirst1
AppFirst1
AppFirst2
AppFirst2

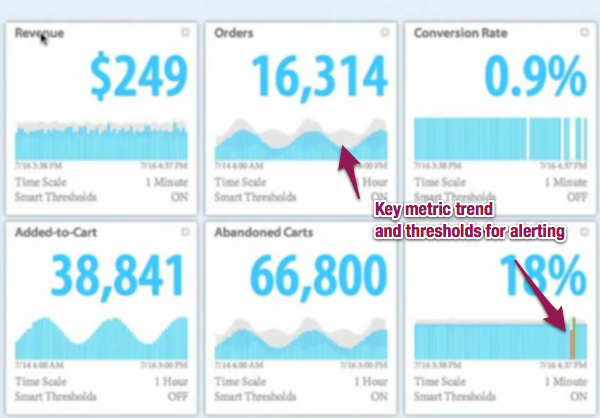
This dashboard is a more traditional real-time operations dashboard. It shows all the key metrics together along with trends relative to goals.  AppFirst has some nice features that you can see in the video including 1) dropping metrics one on top of another to see correlated trends and, 2) "smart thresholds" to highlight points in the historical trends when the metric fell out of an acceptable range.

4. Analysis-One: Creative layout for easy comprehension

Analysis-One
Analysis-One

Many stoplight-style dashboards can be jarring to look at. This radial approach provides the high-level performance warnings in a subtle and pleasing way.

5. Square: Filtering

SquareDashboard
SquareDashboard

Mike Bostock of D3.js fame is the brains behind this dashboard for Square's retail sales. He used his Crossfilter approach for super simple and fluid filtering.

6. Tweetping and Tron, the Movie show us dashboards of the future.

If you want to build a dashboard with a style that will still work 20 years from now, check out the dark backgrounds, tiny fonts, and animation in these dashboards.

Tweetping
Tweetping
Tron Dashboard
Tron Dashboard

If you're interested in more well-designed dashboards, Quora has a good discussion on the topic here.

Who was that guy at the NFL Combine?

This weekend is the start of the NFL Combine. It is where roughly 300 of the top college football players show off the physical prowess, strength, speed, agility to NFL teams to help their status in the upcoming April draft. In case you end up catching a glance of the festivities and want to know a little bit more about the players, below you'll find a few visualizations that might help you learn a little about that player from Lehigh or the guy who did 38 bench presses of 225 lbs.

Use the search capability on each of these to find the player, position, conference or grade that you want to learn more about. We grabbed the data from NFL.com and CBSsports.com. Enjoy!

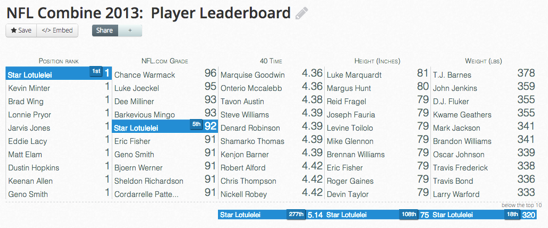
Leaderboard: Ranks players across multiple measures.

The Leaderboard ranks players across multiple measures

Comment View: Read quick summaries of players

NFL Combine Comments

Table: Search, sort, and find player details

NFL Combine Table
NFL Combine Table

Slice is data presentation for the rest of us

carousel-reports21.png

Ok, we're gonna take an informal survey. Raise your hand if you've ever experienced this:

You’re sitting through yet another dull, data-heavy presentation packed full of repetitive charts. A question gets raised, and the presenter flips furiously to find a relevant chart on page 53. A colleague squints at a dense table of numbers, wondering what it all means.

We've all been there. And oh! how painful. Too many times we've seen the aftermath of the indiscriminate boardroom presentation bore-athons. Well, it's time to make it stop!

As a result, we at Juice challenged ourselves to find a way for ordinary business folks to create engaging, interactive presentations that leave the dreary days of Death by PowerPoint behind and bring new life to the data-presentation experience. Our solution is called Slice.

Slice reporting solution

Over the last year we’ve worked with dozens of organizations to refine and enhance how Slice works. Our customers come from a diverse array of industries, from research organizations to healthcare service providers to advertising agencies.

Here's what we learned. There are many great data analysis tools out there like Tableau for ad hoc analysis, SAS and R for statisticians, and a myriad of others. However, we've heard repeatedly from real users that these tools fall flat on helping people become data presenters.

Slice solves that data presentation problem.

Once you've done the analysis and you know what to communicate, packaging the results in the proper way is critical. But, to do it right

  • You want the design to be striking, but you're not a designer;
  • You want engaging interactivity, but you're not a developer and the IT wait list is overflowing;
  • You might cobble something together using Excel and PowerPoint, but mediocrity is not what you're looking for.

Slice removes these constraints by focussing on the last mile of business intelligence: presenting data with the visual precision, interactivity and excellence in a way that sparks engagement.

We are really excited about how Slice makes a difference for people who have struggled too long with delivering data-rich presentations or reports. Interested in seeing the advantage Slice can give you? We've just released a new version and we’d be happy to set you up with a 30-day trial. Go to our Slice page, fill out the form, and we'll be in touch.

Even economists have a story to tell

TEE Map Image
TEE Map Image

Most of our work ends up as business-to-business data solutions (like US News' Academic Insights), but occasionally we create visualization solutions for broader public consumption. One example is the new website for The Essential Economy Council, a non-profit and research organization based in Atlanta, GA. They've collected nine years Georgia Deptartment of Labor data and we're helping them turn it into a compelling and easy to understand story.

Go ahead and check out the interactive map of Georgia to learn about an important and under-represented portion of our economy.